")
State of the art attention models in PyText - Part 1
The code used for this blog-post is here.
Watch on Vimeo - Braneshop - Attention in PyText - Part 1

Attention being computed across a custom-dataset and being dsiplayed in TensorBoard!
I wanted to take some time to discuss a library that seems to have flown under the radar a little bit. It’s called PyText, and we’re going to explore how you can use it to run state of the art attention models!
Here’s our plan:
- Set a dataset,
- See how we prepare the data for training in PyText,
- Get PyText,
- Train it,
- Visualise it,
- Consider extensions,
Finally, we’ll jump in to a fork of PyText where I’ve added a few features that help out during training.
If you want to follow along, all the code for this post is available here.
The Dataset
I’m going to play around with my favourite dataset; my “scites” on SciRate — i.e. those research papers that I’m interested in.
We’re going to frame this data as a recommendation problem:
Given some new research paper, will I be interested in it? And if so, why?
This will be labelled data. Specifically, we will need two fields: title_and_abstract (a blob of text which is the title of the paper and the abstract concatenated together) and scited (a number, 1 if I “scited” it, 0 if I didn’t).
Here’s an example, in Python:
title_and_abstract = """Generalized criteria of symmetry breaking. A strategy
for quantum time crystals. The aim of this paper is to propose a criterion
of spontaneous symmetry breaking that makes reference to the properties of
pure phases defined by a translationally invariant state. By avoiding
any reference to the ground state, at the basis of the standard
approach, this criterion applies to a wider class of models. An
interesting application is the breaking of time translations. Indeed, we
discuss explicit theoretical models which exhibit the prototypical
features of quantum time crystals, without the need of a time-dependent
Hamiltonian."""
scited = 0
arxiv_id = "1906.12293"
(Note: For reference, we’ll also keep the arXiv id around, so we can cross-check more information, as we need it, by visiting the link)
The Dataset - Building it
Now, given that I manage the SciRate website, I have direct access to the database. Here’s the kind of dataset I’d like to build:
- 12,000 datapoints of papers that I’ve “scited”,
- 12,000 datapoints of papers that I’ve opted not to scite,
Then, from that set, I’m going to set aside 1.5k for “validation”, and a further 500 that, I promise you now, I will only use at the end of this article, for the purposes of estimating how well the model is doing. In pictures:

Okay, so let’s now make three csv’s, train.csv, validation.csv and test.csv. For right now we’ll not look into how PyText wants the data formatted; let’s just assume that if we have these CSVs we can munge it into the right format later.
Here’s what I did:
conda create -n pytext-scirate-recommendation python=3
source activate pytext-scirate-recommendation
pip install jupyter psycopg2
Then, in the Jupyter notebook:
import psycopg2

my_user_id = 857
max_items  = 12_000

scited_query = f"""
select
    abstract,
    title,
    uid,
    1 as scited
from
    papers
inner join
    scites on
    scites.paper_uid = papers.uid
    and scites.user_id = {my_user_id}
where
    papers.submit_date > '01-Jan-2016'
order
    by random()
limit
    {max_items}
"""

not_scited_query = f"""
select
    abstract,
    title,
    uid,
    0 as scited
from
    papers
left outer join
    scites on
    scites.paper_uid = papers.uid
    and scites.user_id = {my_user_id}
where
    scites.id is null
    and
    papers.submit_date > '01-Jan-2016'
order
    by random()
limit
    {max_items}
"""

with psycopg2.connect("dbname=scirate") as connection:
    cursor = connection.cursor()

    cursor.execute(scited_query)
    scited = cursor.fetchall()

    cursor.execute(not_scited_query)
    not_scited = cursor.fetchall()

assert len(scited) == len(not_scited) == max_items

train = scited[:10_000]       + not_scited[:10_000]
val   = scited[10_000:11_500] + not_scited[10_000:11_500]
test  = scited[11_500:]       + not_scited[11_500:]

assert len(train) == 20_000
assert len(val)   ==  3_000
assert len(test)  ==  1_000

import pandas as pd

def write_csv (rows, name):
    df = pd.DataFrame(rows, columns=["abstract", "title", "arxiv_id", "scited"])
    df["abstract_and_title"] = (df["title"] + " " + df["abstract"])\
                                .replace("\t", " ")\
                                .replace("\r", " ")\
                                .replace("\n", " ")
    df = df.drop(columns=["abstract", "title"])

    df.to_csv(name + ".csv", index=False, header=False, sep="\t")


write_csv(train, "../data/train")
write_csv(val,   "../data/val")
write_csv(test,  "../data/test")
This is just a little hacked-together bit of code that grabs out papers that I’ve definitely scited, and those for which I haven’t scited. Note that it limits it to those papers from the last 5 years, and also randomly orders them. If we wanted to be a bit more precise, we could do the random ordering according to a seed, but we’re just in a blog post here, so we can be a bit relaxed :)
Note that this code requires the SciRate database, so you can’t run it, but here’s the output: noons scites - download if you want to follow along with this exact dataset.
Great! Now I have my data in the data folder:
04:41 PM noon ∈ pytext-scirate-recommendation ls -alh data
total 26M
drwxrwxr-x 4 noon noon 4.0K Jul  3 17:09 .
drwxrwxr-x 7 noon noon 4.0K Jul  2 08:26 ..
-rw-rw-r-- 1 noon noon 1.1M Jul  3 14:47 test.csv
-rw-rw-r-- 1 noon noon  22M Jul  3 14:47 train.csv
-rw-rw-r-- 1 noon noon 3.2M Jul  3 14:47 val.csv
The sizes look good (i.e. val is smaller than train, and test is smaller still, etc, so my script works!) Let’s continue on.
Preparing the data for PyText
Okay, now that we have some data, let’s see what format PyText wants. Let’s head over to the PyText Documentation.
… turns out we have to first pick a model
Glancing at the Train your first model we can see that we need to build some kind of configuration object; and that in particular we need to decide on a “task” and a “model”. Specifically, we need to build a JSON file like so:
{
  "version": 8,
  "task": {
    "DocumentClassificationTask": {
      "data": {
        "source": {
          "TSVDataSource": {
            "field_names": ["label", "slots", "text"],
            "train_filename": "pytext/tests/data/train_data_tiny.tsv",
            "test_filename": "pytext/tests/data/test_data_tiny.tsv",
            "eval_filename": "pytext/tests/data/test_data_tiny.tsv"
          }
        }
      },
      "model": {
        "DocModel": {
          "representation": {
            "DocNNRepresentation": {}
          }
        }
      }
    }
  }
}
So, let’s think about our problem here as a “classification” problem. We have two independent classes, “scited” and “not scited”.
Now, glancing at the PyText classifiers that they have set up by default, the one I want to use is this one: Lin et al. (2017): A Structured Self-attentive Sentence Embedding. I’m picking this one because, firstly, it’s got this notion of attention. Scrolling through the paper, this is the kind of output we can expect to get from this paper:

Looks cool! It’s certainly the idea we’re going for — a kind of “explanation” — the relevant words are highlighted (with a strength!) indicating why the decision (here, a 1-star review) was made.
Now, glancing at the documentation for the config file, our "model" section will need to be like this:
Going back to the above config, we note that we don’t have a “TSV” (Tab-seperated values) we have a CSV, so we might need something like this:
{
  "DocumentClassificationTask": {
    "data": {
      "source": {
        "TSVDataSource": {
          "field_names":    ["arxiv_id", "label", "text"],
          "train_filename": "./data/train.csv",
          "test_filename":  "./data/test.csv",
          "eval_filename":  "./data/val.csv"
        }
      }
    }
  }
}
(Note: the field_names needs to match the order in the CSV, and furthermore, the fields “label” and “text” are used because they correspond to the names in pytext code, not because they are the names of the columns in our document. Further note: there’s a bug where the TCV-parser doesn’t respect quoted strings with the seperator in them.)
Okay. Ambitiously, let’s just try putting everything together, and running it! I’m going to call it 02-Jul-2019-Run-1.json and it will have:
{
  "version": 8,
  "task": {
    "DocumentClassificationTask": {
      "data": {
        "source": {
          "TSVDataSource": {
            "field_names":    ["arxiv_id", "label", "text"],
            "train_filename": "./data/train.csv",
            "test_filename":  "./data/test.csv",
            "eval_filename":  "./data/val.csv"
          }
        }
      },
      "model": {
        "DocModel": {
          "representation": {
            "BiLSTMDocAttention": {}
          }
        }
      }
    }
  }
}
(Note: It took me a few goes to get this config right; in the first instance I even forgot to include the labels (“0” or “1”) in the original CSV data! But through the magic of blogging, it looks like I got it right the first time!)
Firstly, I’ll just install pytext!
pip install pytext-nlp
Then, I’ll just run it according to the docs!
pytext train < config/02-Jul-2019-Run-1.json
Now, I’m only running this on my laptop; no GPU, and after 3 epochs (~20 minutes) this is what pops out of the terminal:
Stage.EVAL
loss: 0.443127
Accuracy: 81.00

Macro P/R/F1 Scores:
+----------------------+-----------+--------+------+---------+
| Label                | Precision | Recall | F1   | Support |
+----------------------+-----------+--------+------+---------+
| 0                    |      0.77 |   0.87 | 0.82 |    1500 |
| 1                    |      0.86 |   0.75 | 0.80 |    1500 |
+----------------------+-----------+--------+------+---------+
| Overall macro scores | 0.82      | 0.81   | 0.81 |         |
+----------------------+-----------+--------+------+---------+

Soft Metrics:
+-------+-------------------+---------+
| Label | Average precision | ROC AUC |
+-------+-------------------+---------+
|     0 |             0.884 |   0.893 |
|     1 |             0.894 |   0.893 |
+-------+-------------------+---------+

Recall at Precision
+-------+---------+---------+---------+---------+---------+
| Label | R@P 0.2 | R@P 0.4 | R@P 0.6 | R@P 0.8 | R@P 0.9 |
+-------+---------+---------+---------+---------+---------+
| 0     |   1.000 |   1.000 |   0.987 |   0.843 |   0.551 |
| 1     |   1.000 |   1.000 |   0.978 |   0.833 |   0.624 |
+-------+---------+---------+---------+---------+---------+

Matthews correlation coefficient: 0.625

ROC AUC: 0.893
This says that this model got ~80% of the classifications right, and then has a few more details. In any case, this is pretty great!
So, there’s a few directions we can head in, now. Certainly it would be useful to see the training runs in TensorBoard. It would also be great to be able to run inference on a single title and abstract. We could also go into the weeds and try and tweak the model, run it on a GPU, and other such things, to see how far we can push the accuracy up.
Let’s go for the TensorBoard/visualisation option, as it’ll be a useful thing to have, no matter which further steps we want to take.
Visualising the training
It’s no coincidence that I’m choosing TensorBoard here, as this is something that PyText supports out of the box. So let’s follow along. First, we install it:
pip install tensorboard
Observe that there is a runs folder with some data in it:
(pytext-scirate-recommendation) 11:04 AM noon ∈ pytext-scirate-recommendation ls runs
Jul02_08-26-12_gpac  Jul02_08-31-57_gpac  Jul02_10-18-55_gpac  Jul02_10-33-37_gpac
Then, we just run TensorBoard!
tensorboard --logdir runs
(Note: I got a warning that I hadn’t installed tensorflow, but it didn’t cause me any problems.)
Here’s what I see:

Of course, we didn’t run for many epochs, so we don’t see much improvement. (Perhaps it’s also worth noting that after just 1 epoch we were already at 70% accuracy).
Now, this is all well-and-good, but we want something a bit more interesting. At the top of this article, we were promised attention; i.e. that we could see what words were contributing to the predictions. Wouldn’t it be cool if we could see this in TensorBoard?! Yes, is the answer!
Building attention visualisation into TensorBoard
In order to do this, we’re going to have to get funky with the pytext source code (unfortunately, this isn’t a feature that’s supported out-of-the-box.)
This is our process:
- Work out how to get attention out of the model,
- Pick a few fixed samples that we run through the network during evaluation,
- Somehow coax TensorBoard to display those samples with attention.
So, if you’re happy to follow along, first, get yourself a copy of the pytext codebase:
git clone https://github.com/facebookresearch/pytext.git
Now, because we’re going to hack on this local version, instead of the version we’ve installed, you’ll want to uninstall the pytext we installed before, (from within your conda environment), and then jump into your copy of the pytext repo, and install that in “develop” mode, so we can make code changes and have them reflected:
pip uninstall pytext-nlp

# Jump to the folder where you cloned pytext
python setup.py develop
Then, let’s dive in.
1. Getting attention out of the model
We recall we’re using the BiLSTMDocAttention “representation” (remember, this is what we specified in our JSON configuration file). Here, “representation” is the same as an “embedding”, namely, a way of encoding a document as a vector. So, we know that the code related to this thing, should match the description of the model in the paper. This will help us working out which tensor is the attention, in the code.
Now, please note — I’ve looked into this before, way back when I was playing with this repo around 8 months ago (in a previous job); I opened an issue at the time, and it’s still open. So, we’ll attempt to use this blog post as an opportunity to try and make a PR that fixes this problem.
As a result, I know that the first thing to look for is if the relevant parts of the code do two things: 1) expose the appropriate attention tensor, so that it can be used by us to evaluate the attention across the input and 2) correctly implement the “hops” functionality from the paper, so that we get the full power of the attention that the paper (supposedly!) provides.
We’ll address the first item first, as it should be independent of the second. We’ll leave the second item for another day.
So, how do we get the attention out, and display it?
Unfortunately, it turned out to be an involved process. I ended up spending the better part of a day hacking around to make this work. It’s all captured in a branch which you can view here: attention-hacking branch. It’s not super elegant, but it’s enough to keep us going.
Here’s the final config file I ended up using:
{
  "version": 8,
  "task": {
    "DocumentClassificationTask": {
      "trainer":  { "epochs": 20 },
      "data": {
        "source": {
          "TSVDataSource": {
            "field_names":    ["arxiv_id", "label", "text"],
            "train_filename": "./data/train.csv",
            "test_filename":  "./data/test.csv",
            "eval_filename":  "./data/val.csv"
          }
        }
      },
      "model": {
        "DocModel": {
          "decoder": { "has_attention": true },
          "representation": {
            "BiLSTMDocAttention": {}
          }
        }
      }
    }
  }
}
(The main thing is that I added a new config option, has_attention, that lets me introduce this extra functionality without (hopefully!) breaking anything.)
I won’t bore you with all the details (you can glance at the diff above to see what I actually changed; it’s not a lot), but the main highlights were:
- Try not to break everything,
- Pass the attention around so that it can be logged to TensorBoard,
- Hack TensorBoard a bit and log an image instead of text, so that highlighting can be displayed (See this issue for why I had to do this.)
The final thing looks like so, in TensorBoard:
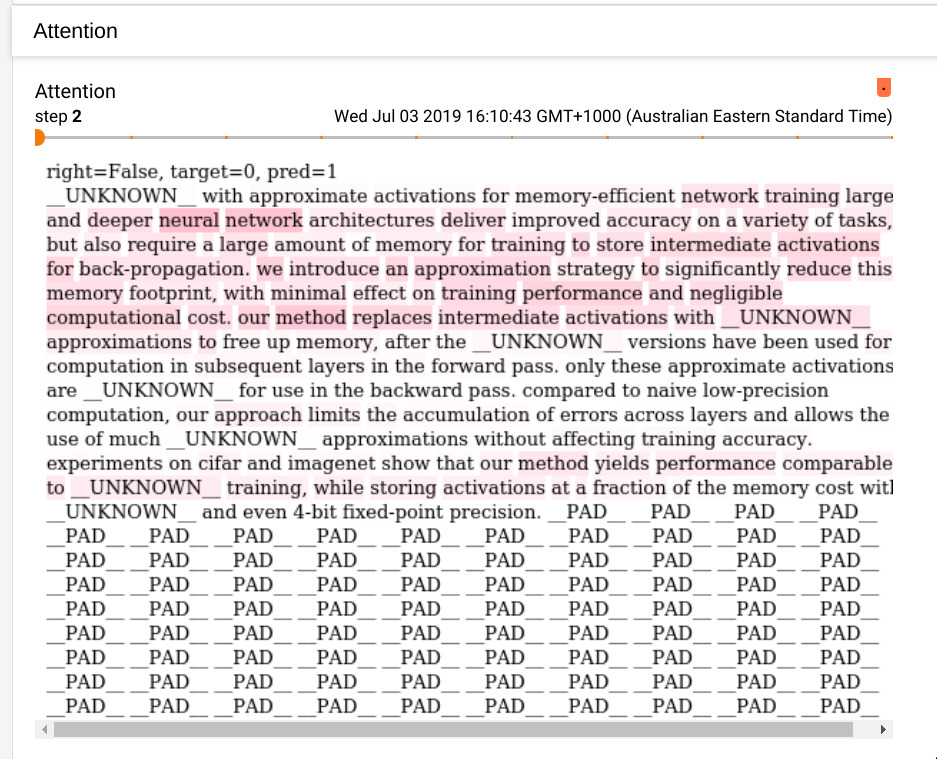
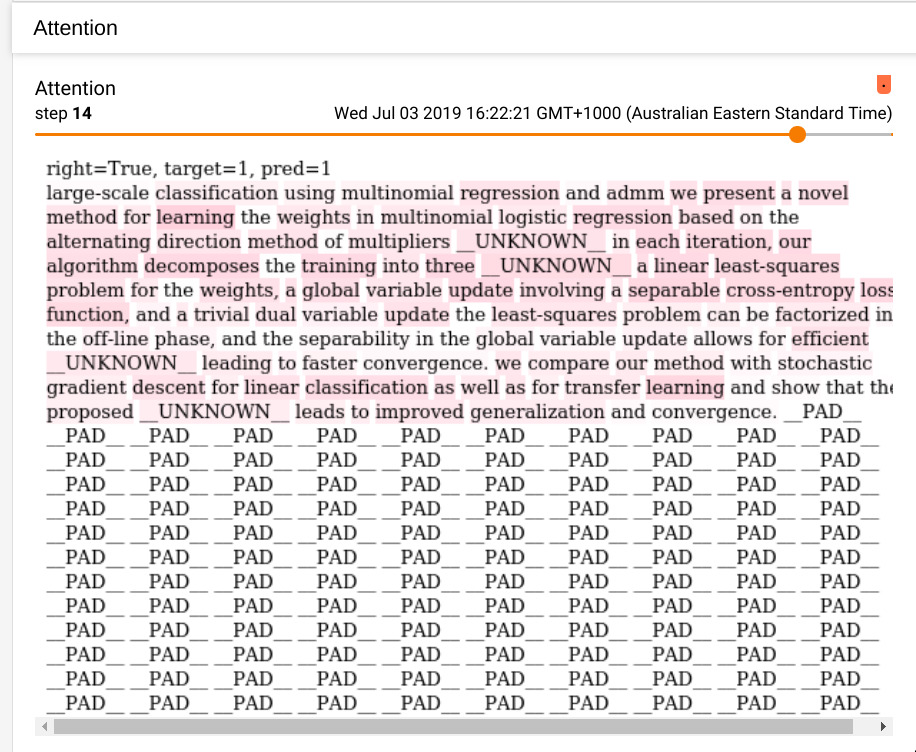
This has the important idea. Namely, the “important” words coloured in. There’s also the tokens (__UNKNOWN__ and __PAD__) that PyText adds, automatically, to deal with low-frequency words and the fact that we need to feed in fixed-length sequences to get the benefits of fast computation on the GPU.
In the next post (this took me so long I had to make it two parts!) we’ll look at the remaining items: Fixing the implementation to match the paper; working out if the attention information it’s providing is even sensible, consider some extensions, and building a little “production-ready” interface!
As always, if you have any feedback/corrections/comments then get in touch!
